

Anyone who's chatted with me about figure design (at least in Astronomy) in the last two years has probably heard my rantings and ravings about some strange color pallet called cubehelix (not to be confused with timecube). I flat out love this color scheme, and I think it could work for you! Here's why:
1. It Works Better for YOU
The most notable feature about CUBEHELIX (or "cubehelix" if you prefer) is that it prints equally well in color and black & white! This is a great time saver when making figures for publications where color is only available online (if like in Astronomy you still use journals with print copies). CUBHELIX accomplishes this by cycling through the RGB cube, while constantly increasing the saturation (black to white). I like this figure, which explains how CUBEHLIX works and its name: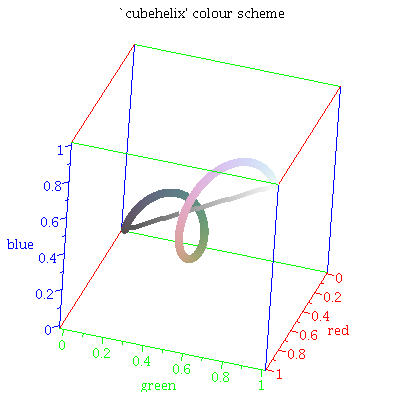 |
| From Dave Green |
To demonstrate the printability, I have made color palettes in both color and black & white for CUBEHELIX and the default for most plotting packages: rainbow:
 |
| Now that's some sweet desaturation! |
2. It's Better for Everyone Else Too!
Since CUBEHELIX desaturates "correctly", people with black & white printers are going to love you. They can print your amazing contour maps out and actually understand them! This goes double for showing figures on projectors. If the red channel goes out, or yellows are weak, your plots are going to be bulletproof. As I've said over and over: if I'm thinking about weird colors in your data visualization, I'm not thinking about the insightful or groundbreaking results you're trying to show.Perhaps even more importantly, CUBEHELIX is pretty friendly for your colorblind readership! Here's an example of my default CUBEHELIX color scheme, followed by simulations for how it is seen by people with three types of colorblindness:

These colorblindness simulations were done via this very nice tool.
CUBEHELIX generally does very well for all these forms of colorblindness, thanks to the constant change in saturation. Approximately 8-10% of men have some form for color perception deficiency, and if you make density maps with normal saturated rainbows you're kicking this audience (possibly students, colleagues, future employers) in the knees. Shouldn't our default color schemes be the easiest for everyone to see?
Fun aside: test how well you can differentiate colors! (I scored a 15...)
3. It's Super Versatile
CUBEHELIX, as defined by Dave Green (2011), has several useful "knobs" you can adjust. This includes: how many times through the rainbow to go, from what color to start, which direction to go (roygbiv vs vibgyor), how fast to go from black to white, and how saturated to make the colors.A few simple examples to demonstrate the versatility! Here I've included 4 tests:
- my default scheme going "backwards" through the rainbow wheel once (rotation = -1, vibgyor),
- once through the wheel the proper direction,
- zero color movement (just black to white) starting at blue,
- and 5 times through the rainbow... because why not?!

This makes a nearly limitless family of color palettes available. If you have multiple datasets to plot together you could use rotation=0 and simply change the starting color. Making heatmap schemes in any hue is effortless. If your figures include both contours and lines/points, you could use the pastel-like CUBEHELIX for the contours and highly saturated/deep colors for the points to make the contrast really pop.
4. You probably already have it
Rejoice! CUBEHELIX is already included in the current version of matplotlib! If you Astronomers use IDL for plotting, I have created an easy to use version. Bonus: David Fanning now includes my CUBEHELIX code in his widely used software library!A few other versions exist as well, check out Dave Green's website for details. If your language environment of choice is not included, and you can create custom color pallets using RGB vectors (or possibly even with hex codes) it is almost trivial to code up the original color scheme as I did in IDL (use the original paper). I'd love to see it added to Tableau...
update:
I have helped put up a version for Tableau
and ported my IDL version to Python!
Finally, here are some fun examples of figures I've created (from this blog) using various CUBEHELIX settings... happy graphing!
|
 |


Binary Clock from James Davenport (or see it on Visually)

This is just dying to be added as a palette to RColorBrewer.
ReplyDeleteYou say...
ReplyDelete>constantly increasing the saturation (black to white)...CUBEHELIX generally does very well for all these forms of colorblindness, thanks to the constant change in saturation
I think you mean brightness, not saturation. Saturation is how "colorful" something is, as in how far it is away from grays (which include black and white). Black and white both are completely desaturated. Black to white is an increase in brightness.
Do you have or know of a resource that lists all the hex codes for cubehelix? If so, there is a method to add custom palettes into Tableau: http://interworks.co.uk/tableau/using-custom-colour-palettes/
ReplyDeleteI'd love to be able to create a preference file to share with everyone in Tableau. I think everyone is pretty tired of the Tableau 20 and cyclic palettes.
I don't have the HEX codes made up, but could generate them from the RGB equations that define the CubeHelix. This of course would only be for the "default" cubehelix settings
DeleteIf you could generate them and send them to me, that would be amazing. Then I can make the preferences file for it and the Tableau world will be rid of weird rainbow charts forever!
Deletehere is a javascript app to try it out.
Deletethere are buttons at the bottom to generate a text file with RGB and or hex codes.
https://www.mrao.cam.ac.uk/~dag/CUBEHELIX/cubetry.html