Showing posts with label maps. Show all posts

PAC-MAN: The End of March Mapness

No comments:
Well we've come to the end of March. I was too busy the past few weeks to keep the high pace of map posts up, but I think we had a few gems. Next year we'll do even better!

For the final post this month, I'm tipping my hat to Google who have created the best map of the month. Starting today, you can play PAC-MANin your browser using Google Maps!

No seriously, try it!


When you go to Google Maps today (and tomorrow, I'd wager), You'll see a PAC-MAN utton. Click that anywhere and you're ready to play on your local streets

This feels a lot like the in-browser version of PAC-MAN that Google featured as a "Doodle" on May 21, 2010 in celebration of PAC-MAN's 30th anniversary. 

Happy April 1st.

When Map Projections Go Awry

1 comment:
One constant irk I have with online map tools such as the venerable, decade old Google Maps, is that the projection is fixed. Most online mapping applications use what's known as "Web Mercator" for their projection.

This works great for most all of my driving and walking around needs!

This doesn't work great for my exploring the world from my couch tasks...

As a simple example:

In this image Greenland is twice the size of the USA. In reality, the USA is about 5x larger than Greenland!

Hilarious side note: I put this post in the blog-queue 2 days ago, yet IFLScience posted almost the exact same article as this yesterday... whoa. Kinda neat!

Maps about Coffee Locations

No comments:
Besides maps, one of my favorite topics to study on this website is coffee!

Here's a simple map I made by overlaying locations of coffee shops onto a map of the UW campus, and drawing some simple circles. What it shows is the walking distance to coffee shops around campus, and that the entire UW campus is covered within a 2-minute walking time! [original post]


Next we extend this idea, and look at coffee shops around the country. Below is a map of the distribution of Starbucks stores in the US. The wire mesh is a triangulation that enables us to find the lowest Starbucks density point, which is around 140 miles from the nearest Pumpkin Spice Latte! [original post]

Finally, here's a really neat series of interactive maps by the MIT Media Lab, showing coverage maps of independent coffee shops in several major cities throughout the US. Below I'm showing a screenshot of the map for Portland, OR. [original post]

Mapping Road Trips

1 comment:
Randy Olsen, moderator of /r/dataisbeautiful, created a great map project about a week ago, which I thought I would the start week 3 of March Mapness off with!

Here is a map of the "Optimal Road Trip", which visits major landmarks in every one of the lower 48 states in the US, as solved by a genetic algorithm:

Randy has an awesome blog post about the project, and includes a live version of the map you can interact with! Check it out here, or follow Randy on Twitter for a near-constant stream of awesome data visualization!

Spinning Maps!

No comments:
Here's a fun recent map I made, using Python's Basemap toolkit. It was a good learning exercise for me, and I was happy to put the code online so others could learn from it. This data is simply the population density of the entire world, saved as a big (lat,lon) grid of values. [original post here]

I love spinning globes/maps for 2 reasons:

  1. They avoid most map projection nonsense about skewing or stretching data
  2. They remind me of the globe I had as a kid, which my brother and I would play with. I remember spinning it as hard as I could, and putting my finger down on random places in the world. I suspect this is a very common experience, and one of the most profound interactions you can have with a visualization....


World Population Density from James Davenport on Vimeo.


Here's another great spinning map, but this time not of Earth. This is the dwarf planet Ceres, and the map is made by stitching pictures together as it rotates. The awesome animation was made by my friend Dr Mike Solontoi! [original page here] Ceres has also been in the news lately because of mysterious bright dots that showed up in the middle of a crater (you can see them in the animation).

I love spinning maps of other worlds, because it makes them feel so much more like real places!


Finally, I can't talk about spinning maps of other worlds without my friend Dr Alex Parker's awesome maps of many extrasolar objects... he's got a whole blog post on spinning moons! [orignal post here] I've featured Europa here, because it looks so damn cool!


Maps of Destruction

2 comments:
Today for March Mapness I am featuring a few maps about destruction

First, a map I created recently charting the locations of all the known volcanoes that have erupted are in the world. Each location is colored by the number of known eruptions. The  incredible "ring of fire" is visible around the pacific rim, with most volcanoes having erupted many times in the past. [original post]


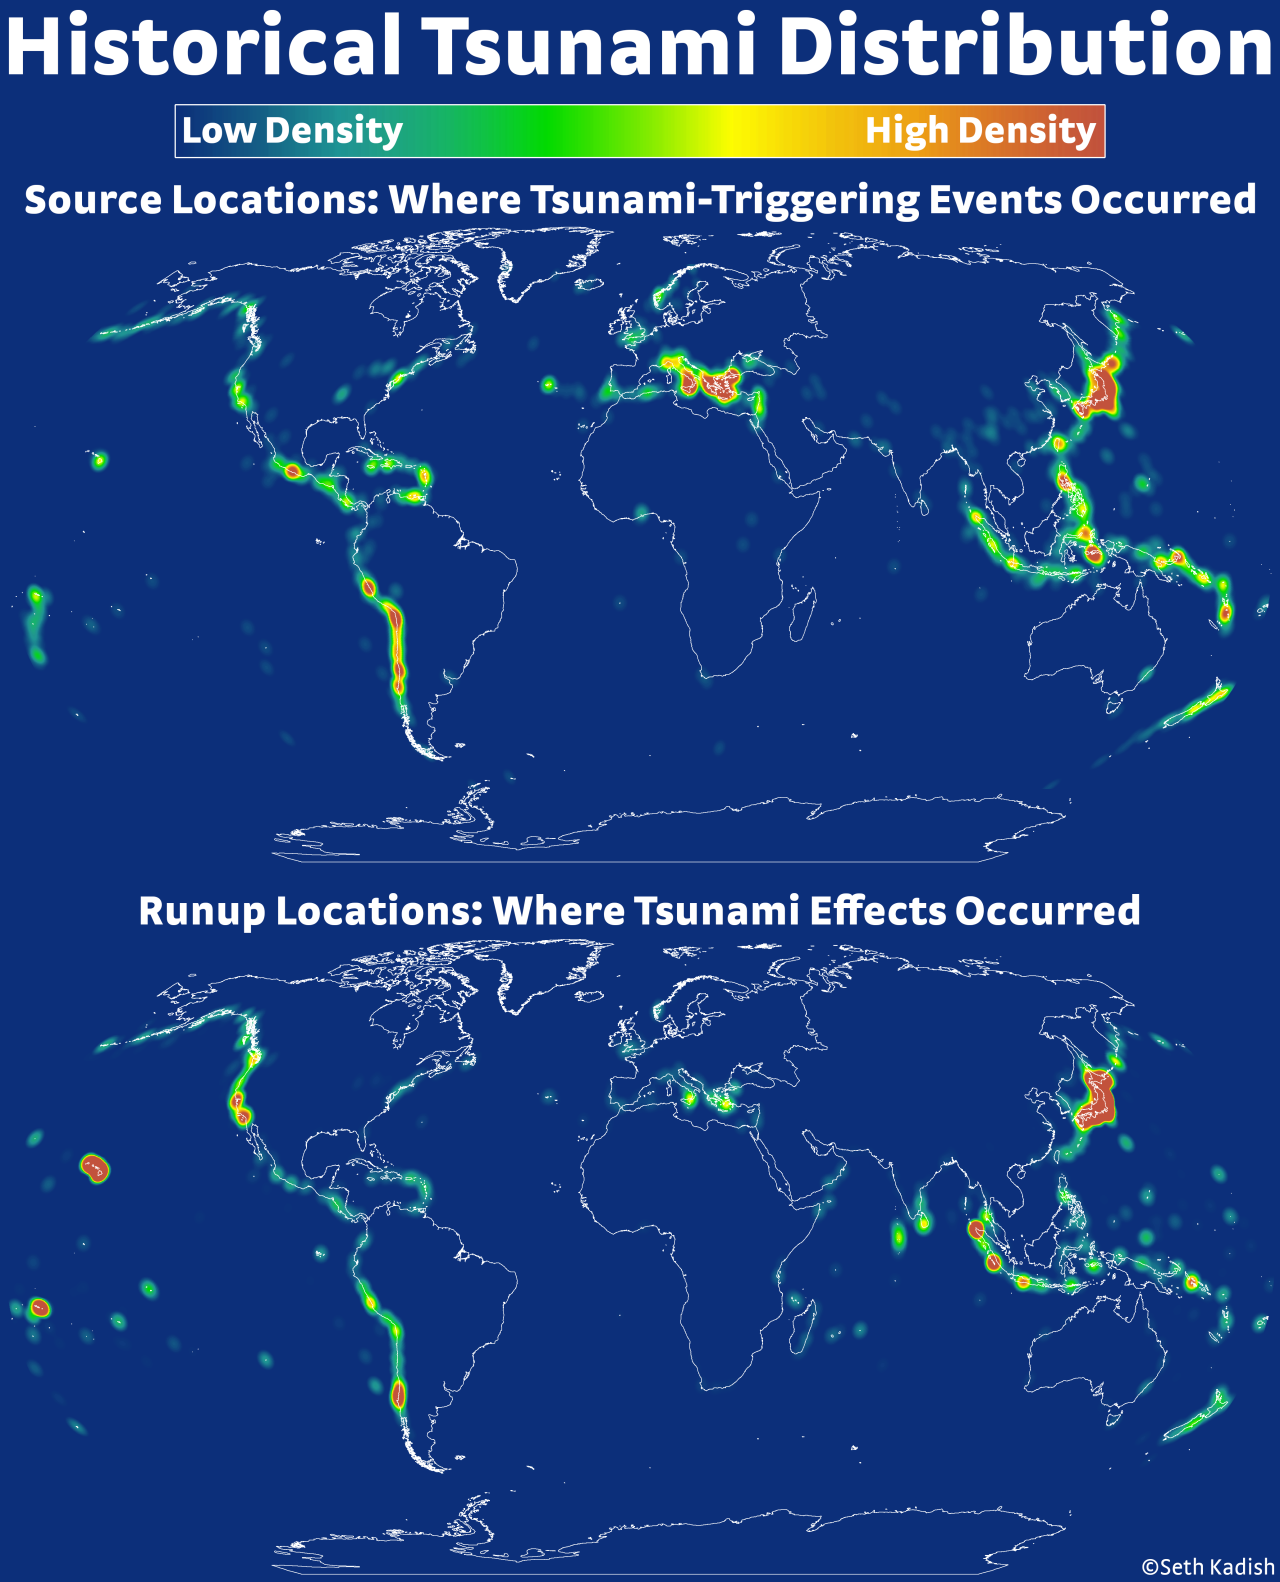
Next is a map from Seth at the always amazing Vizual-Statistix, showing the distribution tsunami triggers worldwide. [original post]. Interestingly, this map seems to resemble the one I made of volcanoes! There's probably a science for that...
Seriously, go follow Seth's work if you're not already!


Speaking of tsunamis, I have mention this incredibly powerful visualization from 2011 about the devastating earthquakes that rocked Japan. I've posted about this video before, as it is one of the most simple and compelling data visualizations I've ever seen.


Finally today, a map of the Black Death plague. There are countless excellent maps on this subject, and the history of disease and data visualization are closely linked. For example, the Broad Street Pump, or Florence Nightingale.
Bubonic plague map


Mapping buses like little ants

No comments:
Here is one of my favorite maps I've generated for this blog: 24 hours of the King County (Seattle) Metro busses zipping about...

Happy day 3 of March Mapness!

[original post]

24 Hours of King County Metro from James Davenport on Vimeo.

Maps of Twitter

No comments:
Maps of Twitter users are fairly common now - but they are still amazing. Here is (a screenshot from) one of my favorites by the good folks at Mapbox [link to interactive map]
This is especially neat, since only a few % of Tweets are geocoded. To be included in this map, you have to Tweet using a device w/ GPS (like your phone) and opt-in to sharing your location. Enough people do to make this fascinating map!

Here is another awesome version by reddit user Kombutini showing Twitter activity over a 24hr period. [Link to original post]


And finally, here's one I made in 2013 showing the average readability or reading ease of Tweets across ZIP codes [original blog post]. It's mostly noise, showing no real trend in readability geographically. What I did find was a significant trend with the % of college graduates per ZIP code, such that ZIP codes with more college grads were Tweeting more complicated language. I thought it was interesting enough to write a short paper on it.

That is just 3 interesting maps of Twitter data, from thousands that have been made and shared online already. What consistently lights up my imagination is how data and social scientists working with companies like Twitter (and Facebook and Google) are using social media or search services, combined with geographic data, to study humanity. We might detect disease outbreaks, natural disasters, possibly intervene when people are feeling suicidal, or judge the mood of society on real issues. It's an amazing time we live in.

March Mapness

No comments:
Today I am proud to announce the beginning of something wonderful and silly:

For the entire month of March I will be publishing blog posts about Maps! As an homage to the famous college basketball tournament, I am calling it "March Mapness". This is an idea of staggering brilliance, and I want it to catch on for the whole data visualization blog-o-sphere. You heard it here first, folks: March is officially the new month of maps in the dataviz world!

I can't promise I'll actually post a map every day, but I will feature some classic map-based posts from years past on If We Assume, cross-post some great content from friends on other blogs, and maybe even generate some new awesome visualizations!

Stay tuned!

World Population Density Animation

No comments:
I have been working on learning to use the mapping package Basemap in Python. This is early learning of machinery for some more posts on maps, and normalizing things by underlying population density.

World Population Density from James Davenport on Vimeo.

Here is a spinning globe with population density drawn. This was code written in 20 min, and took about 100 min to render the images on my laptop. Basemap is straight forward to use... once you know what you're doing. However, the maps don't seem quite as mature as those in IDL (to be fair, IDL has been a commercial mapping product for many years). If you'd like to use this as an example for learning Basemap/Python, the code is on GitHub! I am also working to make the same map using IDL as a teaching tool.

hat tip: got code help from here!

Radio Maps II: Nielsen BDS Stations

No comments:
In part I of this series of posts I made this neat looking map of all FM radio station transmitter coverage in the US:

This is basically a population density map of course, but the data is intriguing for many reasons and the subject matter of listening to the radio on road trips is full of nostalgia.

Once I started making this map I immediately knew that I had to do a few studies on this fascinating dataset! My next goal was to start grouping the stations by genre information. As a first example of this, I am looking at the ~1600 stations that the Nielsen company monitors (excluding AM and Canadian stations, so actually closer to 1200 stations). Here I'm matching/joining the FCC's transmission coverage data to the Nielsen BDS stations using their call sign (e.g. KUOW). I then grouped the stations by genre/format, and used the Python Basemap package (very sloppily) to draw the geographies

Here's the first image in the set:
Your first reaction might be: is this just another population density map?

Answer: no. The Nielsen BDS stations listen to targeted music/programming in certain markets. They don't listen to every Adult Contemporary station throughout the US, only selected stations in key markets. How these markets are determined is beyond me, and probably a matter of trade secrets or voodoo, I'd suppose...

So what we have in these maps is more like the geographic regions where each radio format/genre is considered important, or are good predictors of sales/popularity.

All caveats aside, there are some very interesting trends in the geographies vs genre, which largely track racial and socioeconomic distributions.

Here's an album of all the images (direct link here incase the widget isn't working well)


For my next post on the distribution of radio stations in the US, I'm working to compile a larger database of most every station with a known format. So far I'm aggregating tables from wikipedia, but if you have a line on a more complete list drop me a line! Then I'll be able to discuss the actual geography of musical tastes in the US.

The long term goal for this ongoing project is called RadioTrip, where users could get map directions and radio suggestions along the way based on musical taste. If you want to help with this project, let me know or ping me on GitHub!

Volcanoes of the World

No comments:
Here's a fun figure I made: every volcano on the planet, colored by every known eruption.

(Click for full size)

This data comes courtesy of the Smithsonian Institute's Global Volcanism Program. This dataset includes 10734 known eruptions from 1562 individual volcanoes, going back about 12000 years!

Of course the data are not complete throughout history, but should be quite robust for modern times. For reference, there are 176 entries for eruptions since 2010!!

Our planet is incredible.


update: Some people felt I was under-selling the volcanism of Iceland, and also some folks don't like the Hammer-Aitoff projection I used... so here's another version using a more Euro-centric view and a Robinson map projection:
(Click for full size)

Map of FM Radio Station Towers

2 comments:
Here's a curious map I made.

I was recently driving in the southwest, cruising along long stretches of highway that get no FM radio reception. Usually we need to bring CDs or hook up the iPhone to the car, but we were lucky enough to have a rental with SiriusXM, and it was pretty awesome... but I digress.

As a child my dad told me that FM basically only worked along line-of-sight, and not over very long distances, and that's why we had to listen to The Cars on cassette while driving to the Grand Canyon instead of the radio (I kid, Dad. And also I love The Cars still).

So while I was driving along HWY-380 in New Mexico I started to think about the distribution of radio coverage. To cover most of the country there must be thousands of radio towers! Indeed, there are...  around 27,000 of them in the US alone! Here's a map of their coverage across the country...
(click image for high res)

World Elevations, as Traced by Airports

No comments:
I was looking through some old blog posts and datasets today, and found a gem worth revisiting. One of the simplest and most pleasing datasets I've played around with on this blog was from OurAirports.com, a totally open source database of 46k and counting airports/landing strips/helipads.

I've blogged about this dataset before in Airports of the World, which featured this image:


I went back to this dataset and found another interesting/simple parameter besides latitude and longitude. Most of the airstrips included runway elevation! So I naturally wondered: could we see an elevation map of the world using only airport locations?
Click image for higher resolution!


I've used an adaptive pixel size here to generate this figure, so where there are more airports you see finer resolution. (Code available on github) The US has amazing detail, and as the number density of airports drops off the pixels gradually get bigger!
Click image for higher resolution!

I think the dataset is really lacking detail in Asia. Check out this area of Eastern Asia and some of the South Pacific. Fascinating (to me) there are some VERY high elevation airports/landing pads in China in the Himalayas.
Click image for higher resolution!
I really like the use of the adaptive pixelization, especially in the USA map. I played around with different kinds of grid/pixel schemes, including using voronoi triangular regions, but I liked the aesthetic of this simple brute-force pixel approach. (Code available on github)

One comment I made about the initial Airports of the World visualization was simply my amazement in how much of our planet is accessible by air travel. This new version adds another dimension, and shows the incredible range of elevations that people live at.

Astronomical Map Projection

No comments:
I've been enjoying a cool website called Astronomy Image Explorer (http://www.astroexplorer.org), which aims to provide image search for our scientific literature.

I think this is a brilliant idea because most astronomers read a lot of journal papers, often searching through them for a very specific result or point. As such, the graphs are usually the most memorable piece of the paper. (Thus: you should invest time in to making your graphs clear and easy to read, but I digress)

AstroExplorer.org is somewhat limited in function compared to other image searching tools online. However, they specifically connect the image with figure captions and authors, which is awesome. While I'd still like to see things like TinEye (reverse image search), expanded logic operators, and more API support included, AstroExplorer.org is a really neat idea!

I was playing with AstroExplorer.org while at the "Thinking with your Eyes" symposium and wondered: what we could learn about the style/type of graphs and maps astronomers use? This is a broad question, and really in the domain of HCI/visualization research.

One simple avenue was to focus on maps, specifically map projections in astronomy. Often in figure captions the authors will state the type of map projection (which I would encourage!) particularly if the map covers a large field of view and distortion/projection effects are significant. So for a simple case study, I went looking for how many occurrences of different map projection names I could find in figure captions.

Of course this is not comprehensive in any way, but the results are interesting!


I'm just counting up the number of results when searching for each term. In the case of "Robinson", I did a search for "map" within the search for "robinson" (too many authors named Robinson came up).  The distribution matches my intuition, as I see mostly Aitoff (or Hammer-Aitoff) projections in papers. I also don't know what fraction of papers are indexed in this search.

A few projections I didn't find any results for include: Eckert, Pseudocylindrical, conic, gnomic, Dymaxion, and Goode Homolosine. A challenge for a future journal article, perhaps?

Galactic Map Projections

6 comments:
One of my absolute favorite scenes from The West Wing (one of my favorite shows) wasn't about politics, or war, or even the President. Instead, it was a quirky plea to change the default map projection used when teaching children about the world. For your amusement, here's the clip...

sorry - clip has been removed from YouTube. I'm sure you can search and find the West Wing clip about map projections with little effort...

For the curious, some more details about the Gall-Peters projection!

Map projection isn't just a concern for cartographers, city planners, or ocean travelers. Astronomers deal with maps all the time as well! (Sometimes we astronomers forget this.) For example: one of my absolute favorite graphs from the last decade in astronomy comes from the SDSS, and is titled the "Field of Streams"...

Credit: Vasily Belokurov, SDSS-II Collaboration
This is a map of very faint sub-structure seen in our Galaxy using the SDSS. To give you a sense of scale, here is a comparable region (angularly speaking) of Earth using an even-spaced grid of lat/lon as in the figure above. Distortion of the far northern latitudes is (or should be) very apparent!


So let's playfully extend the logic from the West Wing. If using traditional Earthly map projection can lead to generations of international strife, then our concern for heavenly projections should be far greater! Consider the interstellar politics at play, and the need to avoid a false sense of Orion-Imperialism. I hereby create the Organization of Astronomers for Celestial Equality (OACE - now accepting membership applications).

Let us consider, what does your Galaxy really look like?

For this example, I've grabbed 2.5 million random stars from 2MASS, a famous infrared all-sky survey. Here is a density map of the Milky Way (from our vantage point) in the most basic map projection: uniform steps in latitude and longitude.


Here is the same data in a handful of other projections...
Sinusoidal

Robinson


Mercator

Hammer

and my personal favorite of the set...
Goode Homolosine

Look at how far the LMC and SMC appear to move between projections! What do you think, which is the best projection? Which is the most accurate for astronomy?

Airports of the World

8 comments:
I've been busy in astronomy-land recently, trying to make some headway on my thesis before beginning a summer internship (more on both hopefully in the coming months!) For this site, recently I've been playing with some interesting data, trying to find the "story" - which is really a way of saying I haven't found the truly clever question yet. Lots of pretty/interesting visualizations have been made, however.

In the meantime, I thought the following map was pretty incredible. I present:
The World, Traced by Airport Runways.

This was generated using 45,132 runways (awesome data from here). Think about that number for a moment: there are at least 45,000 places to land an airplane! These range from small dirt fields to LAX, and the data seems to be more complete in the USA. Still, runways on every continent, seemingly every country.

Incredible!

Update: You can now purchase a poster version of this map. Neat!
Airports of the World Poster
Airports of the World Poster by IfWeAssume
View custom art Posters & Prints at online Zazzle


How we Perceive Racial Demographics

No comments:
Last year I conducted a short online survey to (attempt to) answer a simple question:
How accurately do people know the racial demographics of their neighborhood?

This was prompted by overhearing a great many generalizations about the racial composition of Seattle, and the UW in particular. The survey was straight forward: simply provide your guesses for the % of each race in your neighborhood, as well as a few details about yourself (age, gender, race, and most importantly ZIP code in the USA). The ZIP code was used to compare the user-estimated %'s to data from the US 2010 census.

I'd like to share a bit of what I learned...

1. Respondents, or, The Kindness of Strangers


The Greasiest Spoon in Town

2 comments:
Got the Google Reader blues? Get updates for If We Assume via email


Last month KIRO 7 reported on the "10 Dirtiest Restaurants" in Seattle (link to story now dead).  Several establishments near UW were featured, and in the past month its been fascinating to watch how they (and the student patrons) reacted.

One UW-area Thai place on said list was quite upset, as they apparently have the same name as another Thai restaurant, and felt it was a case of mistaken identity. They posted a sign decrying the bad press, which didn't last long. My by-eye gauging is that their business maybe took a couple day dip, but has remained strong. Also - the place is by no means "clean".
Just down the 'Ave is a teriyaki restaurant, which absolutely deserves to be on this filthy list. I've had some frightful meals here over the past decade...

This got me thinking about restaurant inspections and food safety across the city, and I went in search of the data that could answer the question: where are the best & worst places to eat in Seattle, according to food inspectors?  Mixing in some GIS shapefiles of Seattle neighborhoods, here's what I came up with:


The data contained about 192k inspections, spanning 2002 - 2009. More recent data was also available, but to get the general map this was all I needed.

There's lots of other fun things one can do with such a large database, including looking at when the food inspectors are most likely to visit a given location, and even when most restaurant inspections occur:
This map, and the initial KIRO report, are examples of the every-day insights you can gather from public data that society is collecting every day. Personal food/restaurant reviews are another great source of insight. Combining these, it could be very interesting if (e.g.) Yelp included the most recent food inspection reports for restaurants. Wouldn't you want to know? Fun stuff.

FYI: King County's Public Health reporting system can be found here.

Planck vs WMAP: CMB OMG

No comments:
There has been a lot of press and interest today for the first results from the Planck mission.  The headlines read "Planck reveals an almost perfect Universe", which I'm sure will finally win the telescope some loving approval from it's high-expectations namesake...

This space telescope is busy measuring the Cosmic Microwave Background radiation, the fleeting thermal glow from the early universe. You can observe a piece of the CMB too - if you have an old TV, just turn it to static. Actually only a few % of that static noise is due to the CMB, but it's fun nonetheless!

When I was an undergrad I thought the CMB map produced by WMAP (the previous big name in this game) was incredible. Here's an animated gif I whipped up this morning comparing the Planck to WMAP results...

Two things stand out to me:

  1. Planck has remarkably better spatial resolution
  2. Planck chose a very different color scheme (smells like Python)

Planck was smart to ditch the gaudy rainbow color scheme. However, neither map does terribly well for colorblind people. Here I've run both the WMAP and Planck CMB maps through the handy online Vischeck tool...


Both these figures also desaturate very poorly to black/white, though the WMAP does a bit better. This is nitpicky, of course, but if you're going to have your results plastered across the world, choose a good color scheme. This is all in loving jest. Congrats to the Planck team on their great work!

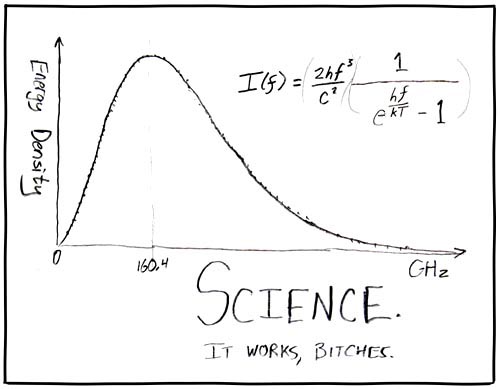
Of course, no report of CMB results are complete without this seminal figure...