Planck vs WMAP: CMB OMG

No comments:
There has been a lot of press and interest today for the first results from the Planck mission.  The headlines read "Planck reveals an almost perfect Universe", which I'm sure will finally win the telescope some loving approval from it's high-expectations namesake...

This space telescope is busy measuring the Cosmic Microwave Background radiation, the fleeting thermal glow from the early universe. You can observe a piece of the CMB too - if you have an old TV, just turn it to static. Actually only a few % of that static noise is due to the CMB, but it's fun nonetheless!

When I was an undergrad I thought the CMB map produced by WMAP (the previous big name in this game) was incredible. Here's an animated gif I whipped up this morning comparing the Planck to WMAP results...

Two things stand out to me:

  1. Planck has remarkably better spatial resolution
  2. Planck chose a very different color scheme (smells like Python)

Planck was smart to ditch the gaudy rainbow color scheme. However, neither map does terribly well for colorblind people. Here I've run both the WMAP and Planck CMB maps through the handy online Vischeck tool...


Both these figures also desaturate very poorly to black/white, though the WMAP does a bit better. This is nitpicky, of course, but if you're going to have your results plastered across the world, choose a good color scheme. This is all in loving jest. Congrats to the Planck team on their great work!

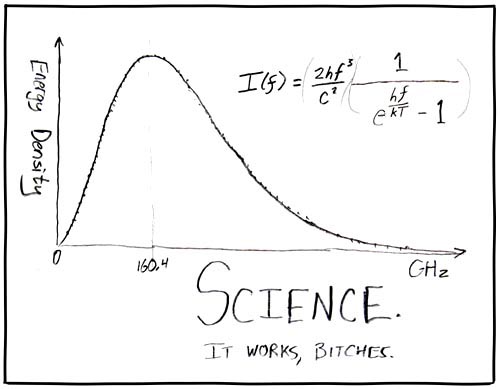
Of course, no report of CMB results are complete without this seminal figure...
My Ignite Seattle 19 Talk

No comments:
Last month I gave a short talk at a super fun event: Ignite Seattle. If you don't know, Ignite is an awesome ongoing series where people give (hopefully) interesting talks. Each presentation is only 5 minutes and the slides auto-change every 15 seconds. This makes it especially fun and challenging for the presenters!


The wonderful Ignite organizer, Monica Guzman, also interviewed me for the Seattle Times Blog, which also led to a fun radio interview last week! I had a total blast with the Ignite talk. The crowd was about 730 people, and tons of positive energy! I'd love to do another Ignite, maybe next time on astronomy stuff.

I also learned a lot by prepping for this talk. I probably practiced 25 times over a couple days, which I think helped immensely. Everyone should be required to give talks like this where you have no control and no ability to go over time (*ahem* AAS)

Visualizing Devastation

No comments:
This week marked the second anniversary of a terrible natural disaster, the 2011 Tohoku earthquake in Japan. We watched the destruction unfold on television, hoping the friends we had in Japan were safe. It was absolutely heartbreaking and stunning to watch.

This earthquake was the 5th most powerful ever recorded (smaller than the 2004 Indian Ocean quake and the 1964 Alaska quake), and had massive after-shocks for months. Here is a very well done visualization that shows all the seismic activity around Japan in 2011

I watched this probably 4 times. It's brilliant and sobering. At first the subtle noises associated with each 'quake seem silly and unremarkable. When March 11 hits everything changes, and you're drawn in by sound, the sight, the movement...

The yellow line is the cumulative number of earthquakes per day. Before the big event the line is straight, a roughly constant background of small quakes that are always present  in the ring of fire. By the end of the video, this line still hasn't gone back down to the normal flat line, indicating the rate of earthquakes per day is still much higher than before.

All I can say is wow. A beautiful visualization of a terrible disaster.

Rowing Across an Ocean of Contours

3 comments:
Today I'm very happy to feature a guest post from my friend Angie Pendergrass, a PhD student in the Atmospheric Sciences department here at UW. She's got the mother of all side-projects: using her data analysis and climate modeling skills to help predict ocean currents for a group of crazy brave rowers...


Imagine you're rowing a boat across the ocean. You can't row very fast, just 3 knots if you try your hardest (that's a little slower than walking speed.) You have 4000 nautical miles nautical miles of sea to cover. Scattered across the ocean surface, you know there are some favorable currents and some eddies, spinning whirlpools of water about 50 nautical miles across, with current up to at least one knot. They can help you if you can ride them favorably, or they can suck -- a lot -- if they're against you. You really need to know what these eddies are doing!

Luckily you have a team of weather forecasters and a navigator ashore helping you out. There are actually some guys doing this row, called OAR Northwest. They set out from Dakar, Senegal in late January for Miami, Florida, and now they're halfway across the middle of the Atlantic; check them out at oarnorthwest.com. Your guest-author is their lead weather forecaster.

So now you should be super excited to hear that the National Center for Environmental Prediction (part of NOAA) runs a model of the ocean that diagnoses the ocean surface currents. Great, this is perfect! Let's take a look!