

“...I wondered if it was blasphemous to tell God that rainbows are kitsch.”
--Steve Toltz, A Fraction of the Whole
Color is one of the most fundamental, and sometimes most challenging, aspects of data visualization. Many times you may not know why a given color scheme looks bad (or good), but your eye can quickly pick it out. There are many schools of thought about color families, color meanings, complimentary colors, and which you should use in figures/plots. The rainbow color table, a default in many programs/languages, frequently produces horrible results. You can do better! Your research deserves better. If people have to squint and struggle to decrypt your colors, then your result isn't being communicated.
Below is a list of links/articles/references I've found useful when thinking about colors in visualization, with some rough organization. Favorites of mine in each section are in bold. The list was compiled with help from my friend Ryan, and I hope it will be of use to you!
Interactive Color Design Tools
These are probably the best tools to play with and get interested in color. Each has it's own strengths, and many applications/languages don't provide obvious ways to import other color schemes. You should still look here for inspiration, especially when choosing color palettes for talks or posters.Academic Articles
Here are some more "academic" oriented articles, giving intros to color and to general problems people encounter in using color in research figures. Graphic designers will probably swallow their gum when they look at some of these, and realize how primitive the understanding and use of color often is within science. Scientists would be greatly helped by taking a beginners course on graphics design (myself included!!!!) but it's been my experience that many think it's a waste of time to worry about such things.- A phenomenal article on why scientists should care about color by Rogowitz & Treinish (1996)
- Practical Rules for Using Color in Charts by Stephen Few [pdf]
- An intro to color spaces by Rishidev Chaudhuri on 3quarksdaily
- Choosing Effective Colours for Data Visualization by Healey (1996) [pdf]
- Choosing Colors for Data Visualization by Maureen Stone (2006) [pdf]
- Rainbow color map (still) considered harmful by Borland (2007) [pdf]
- Nature article on color coding by Wong (2010) [warning: pay wall]
- CubeHelix: my personal favorite color scheme tool. (Shameless plug: I wrote the version for IDL that is now included in David Fanning's seminal library)
- Wikipedia article on HSL and HSV
- A TedX talk by Michelle Borkin, showing a great example of the utility of proper color choice [YouTube]
- How Colours Make Us Buy by Terry O'Reilly at the CBC, a fun look at product/logo color choices, and their impact on sales
Color Contrast
Contrast is one of THE biggest problems I see in academic figures. Things like cyan or yellow on white, red on blue, navy on black... these cause major problems (and headaches) when reading text or trying to discern between lines. Your plot doesn't have to be pretty, but it does have to be legible!- A tutorial on color & contrast by worqx
- A great list of links and tools on color contrast by @rogerjohansson
- Tufte in Practice: Value in Contrast [pdf]
Considering Color Blindness
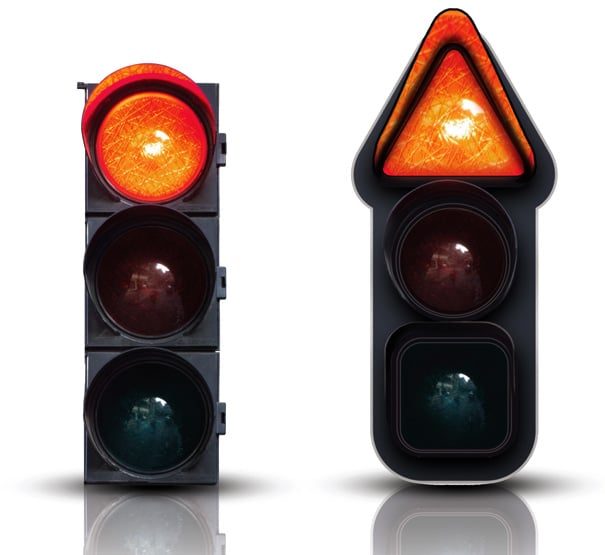 |
| A standard traffic signal (left) and color blind-friendly design (right) |
- Color Universal Design
- A handy tool for mimicking how color blind people would see your image
- A decent thread from the Edward Tufte forums
- This design for a color blind-friendly traffic signal
Concluding Thought
It's my opinion that considering color choices (along with font sizes, line thickness, plot symbols... ) should be standard practice in science. Just there mere act of spending a few minutes extra on a figure, asking yourself "is this easily readable?" or "how will this look when printed in black and white?", will lead to immediately better plots. We put a ton of effort in to considering measurements, units, trivial details about wording, measurements, biases... why should the (esp. visual) communication of our results take second billing??Do you have good links/references for learning about color choices in data visualization? Post them in the comments below and I'll update this post!
[ Related Posts ]

|
| The Best Data Visualization Sources |

Thanks to so many helpful comments on reddit! I've been able to add 2 new links, and started reading up about some more history of color theory!
ReplyDeleteFor those that like Color Brewer and use matplotlib: https://github.com/jiffyclub/brewer2mpl
ReplyDelete